Use case: Value of retirements vs. GDP
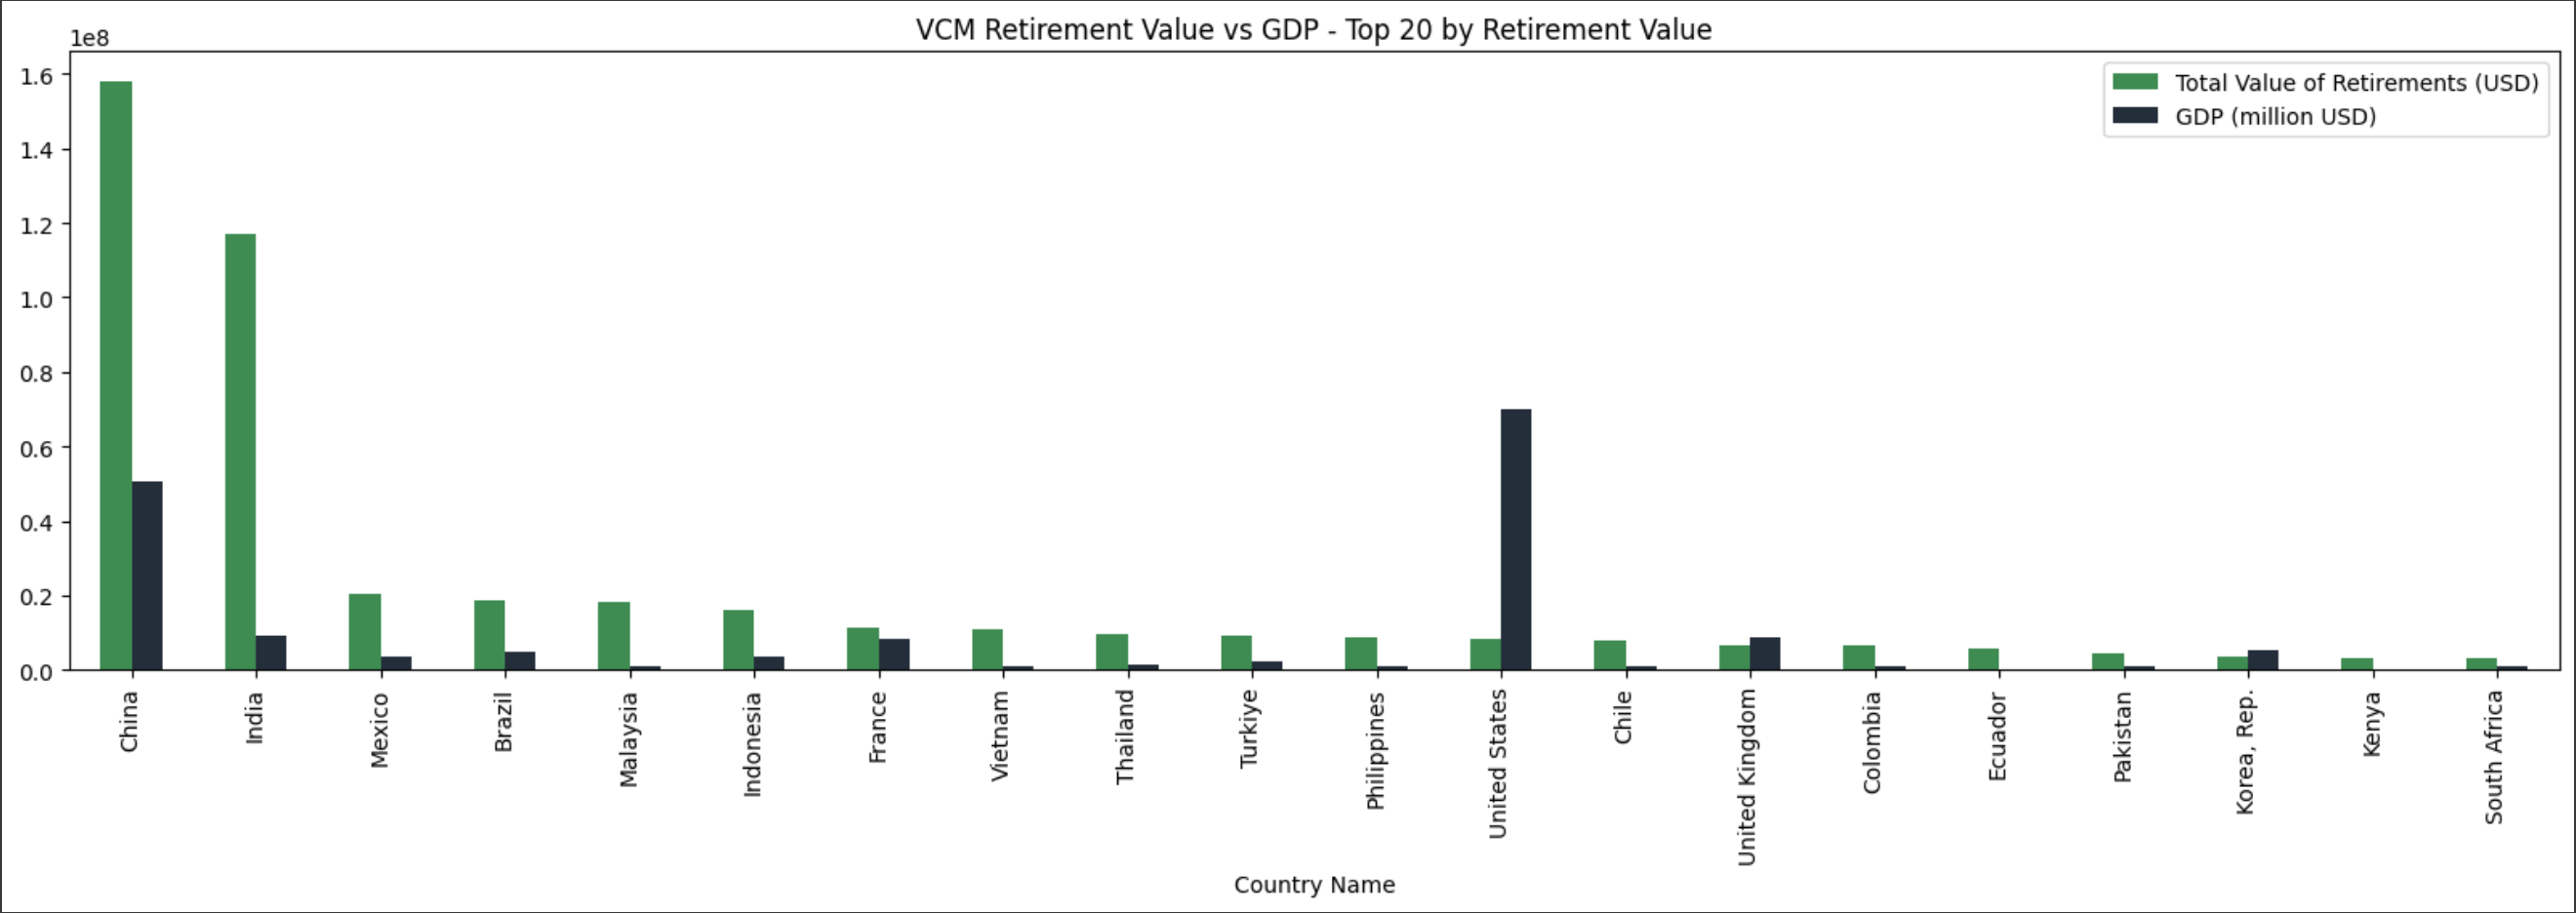
The below script allows one to quickly understand how much value carbon projects generate in each country, compared to the national GDP per capita. Simple visualizations help to make the ratio more intuitive and immediate. The script builds on two of the main AlliedOffsets’s database tables: project-level information and our industry-leading and proprietary pricing estimates for each credit transaction. The script is written to easily allow you to select a sub-set of countries that you might be interested in, and offers you additional sources that you can consult for GDP information.
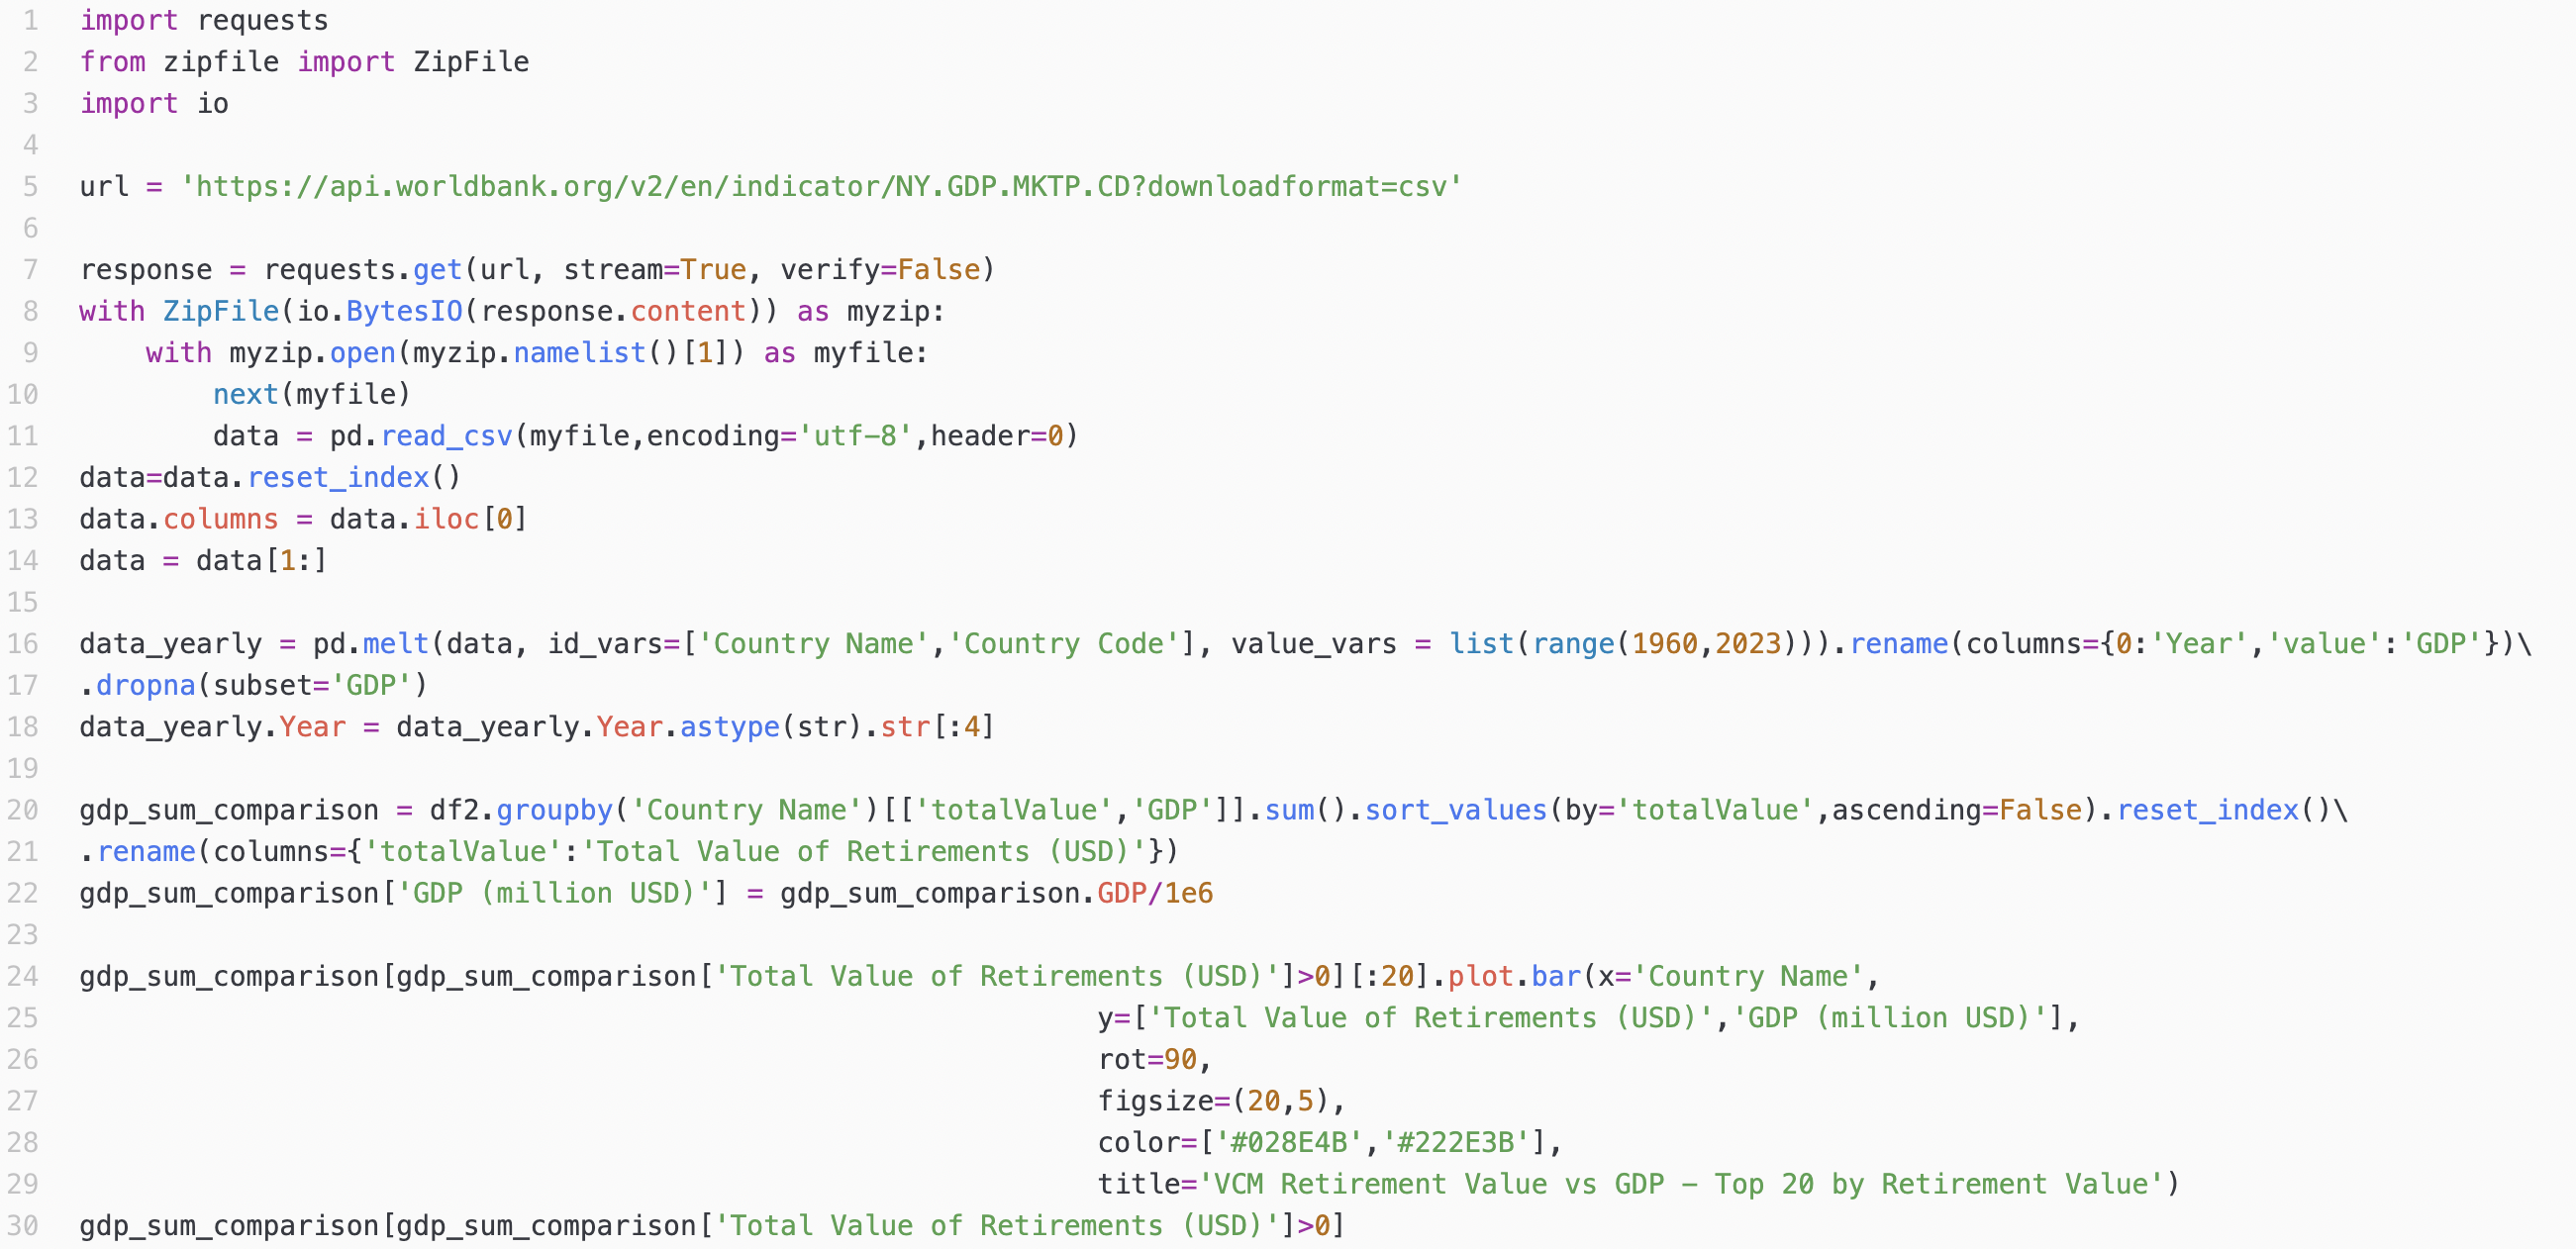
In order to generate the result, the following code can be run once you have an AlliedOffsets API: Credits value vs. national GDP
Use Case 2
The below script allows one to quickly understand how much value carbon projects generate in each country, compared to the national GDP per capita. Simple visualizations help to make the ratio more intuitive and immediate. The script builds on two of the main AlliedOffsets’s database tables: project-level information and our industry-leading and proprietary pricing estimates for each credit transaction. The script is written to easily allow you to select a sub-set of countries that you might be interested in, and offers you additional sources that you can consult for GDP information.
In order to generate the result, the following code can be run once you have an AlliedOffsets API: Credits value vs. national GDP
Use Case 3
The below script allows one to quickly understand how much value carbon projects generate in each country, compared to the national GDP per capita. Simple visualizations help to make the ratio more intuitive and immediate. The script builds on two of the main AlliedOffsets’s database tables: project-level information and our industry-leading and proprietary pricing estimates for each credit transaction. The script is written to easily allow you to select a sub-set of countries that you might be interested in, and offers you additional sources that you can consult for GDP information.
In order to generate the result, the following code can be run once you have an AlliedOffsets API: Credits value vs. national GDP
Use Case 4
The below script allows one to quickly understand how much value carbon projects generate in each country, compared to the national GDP per capita. Simple visualizations help to make the ratio more intuitive and immediate. The script builds on two of the main AlliedOffsets’s database tables: project-level information and our industry-leading and proprietary pricing estimates for each credit transaction. The script is written to easily allow you to select a sub-set of countries that you might be interested in, and offers you additional sources that you can consult for GDP information.
In order to generate the result, the following code can be run once you have an AlliedOffsets API: Credits value vs. national GDP
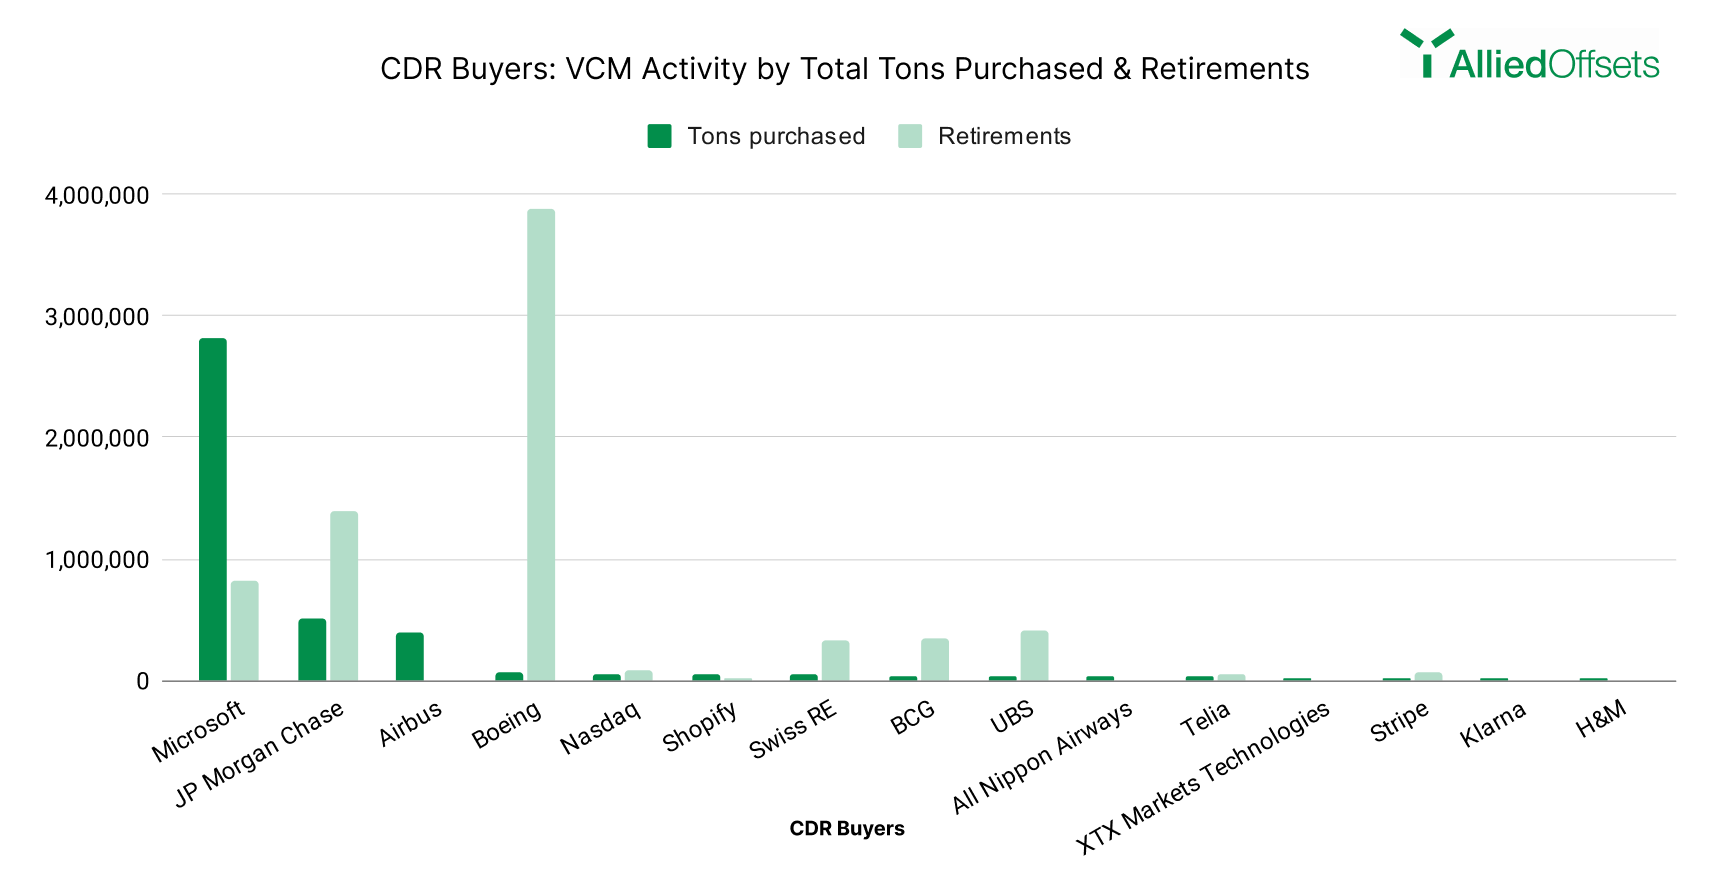
We’ve been analysing the top CDR buyers to compare to their overall activity levels in the VCM.
Here’s an overview of the top 15 CDR buyers and the total tons they purchased from CDR firms vs. their activity in the ‘traditional’ VCM.
As we can see in the graph, Microsoft remains the biggest spender in terms of credits purchased (almost 3 million) and Boeing tops the chart in terms of overall retirements with a total of almost 4 million.